Revenue Pattern Shifts in Digital Gaming Markets Across Major Event Windows
Written by Finley Carter · Jul 21, 2026
Revenue Pattern Shifts in Digital Gaming Markets Across Major Event Windows
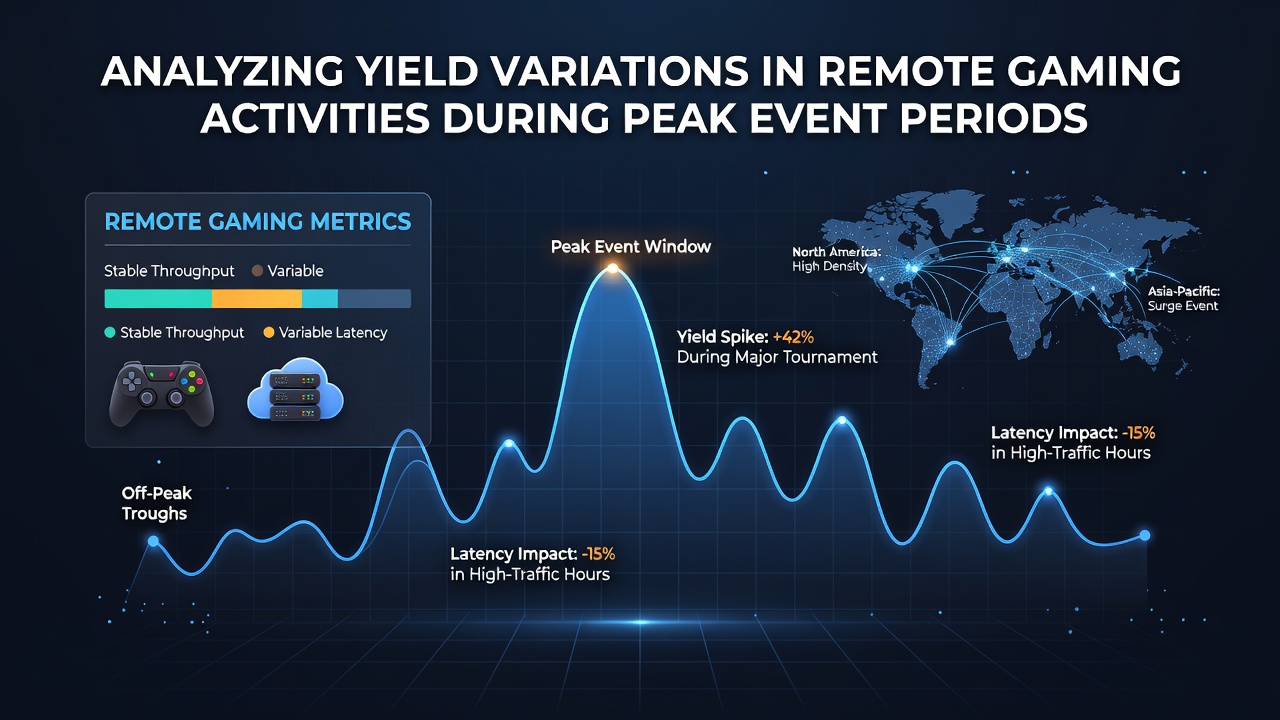
Observers note that remote gaming platforms experience measurable fluctuations in yields whenever large-scale events draw concentrated player attention, and these shifts become especially pronounced during periods like the 2026 FIFA World Cup summer schedule. Data from regulatory filings shows increased session volumes coinciding with live matches, yet average returns per player often diverge from baseline figures because bet sizing patterns and game selection change under time pressure.Defining Yield in Remote Gaming Contexts
Yield calculations in remote environments typically track gross gaming revenue against total wagers placed, and analysts break these figures down by verticals such as slots, table games, and sports betting products. During ordinary trading weeks the ratios remain relatively stable, whereas peak windows introduce variables including promotional bonuses, altered payout frequencies, and rapid deposit activity that compress or expand margins depending on player behavior clusters.
Researchers tracking multi-year datasets find that yield compression occurs most frequently when recreational participants dominate volume, while segments favoring high-stakes table games may produce temporary expansions before normalizing. July 2026 schedules, featuring overlapping international football fixtures and domestic horse racing calendars, provide fresh opportunities to measure these dynamics across different time zones and regulatory jurisdictions.
Event-Driven Traffic Surges and Their Effects
Traffic logs from major operators reveal session counts rising between 40 and 120 percent on match days compared with adjacent midweek periods, and this acceleration concentrates around specific hours tied to broadcast schedules. The resulting data streams allow segmentation by geography, device type, and payment method, revealing that mobile users contribute disproportionately to short-duration, high-frequency bets while desktop sessions extend longer and favor strategic play.
What's interesting is how these traffic patterns interact with game mix; sports betting handles swell dramatically, yet casino verticals simultaneously record elevated slot spins because players often maintain parallel sessions. Yield therefore reflects both the sports margin and the house edge realized on digital reels, creating composite figures that require careful decomposition before comparisons across events become reliable.
Regional Regulatory Data and Comparative Metrics
Figures released by the Nevada Gaming Control Board illustrate that remote sports betting yields during championship weeks have varied between 4.8 and 7.2 percent over recent cycles, with the lower end appearing when heavy favorites attract lopsided action. Parallel reporting from the Australian Gambling Research Centre indicates similar compression during major cricket and rugby internationals, where promotional free-bet credits dilute realized margins until the underlying wagers settle.
One study revealed that European operators registered through the Malta Gaming Authority experienced a 15 percent lift in aggregate handle during the opening fortnight of the 2026 World Cup qualifiers, although net yields declined modestly once bonus wagering requirements were factored in. Observers tracking these markets note that the variance narrows once the initial novelty of the event subsides and player cohorts stabilize.

Behavioral Factors Influencing Yield Stability
Player segmentation models indicate that loyalty program members maintain steadier yield contributions because their play volume distributes across multiple verticals rather than concentrating on single events. In contrast, event-driven sign-ups often cluster around high-volatility products, producing wider outcome distributions that affect short-term reported yields even when long-term house edges remain constant.
Payment timing also plays a role; deposits made immediately before kickoff correlate with smaller average stakes and quicker session exits, whereas pre-event funding tends to support extended play. These patterns emerge consistently in transaction logs, allowing operators to adjust real-time risk parameters and promotional targeting without altering core game mathematics.
Analytical Tools and Forecasting Approaches
Statistical teams apply regression models that incorporate historical event calendars, weather impacts on outdoor sports, and social media sentiment indices to project handle ranges days in advance. Once live data arrives, dashboards update yield estimates hourly, flagging deviations that may signal either promotional over-delivery or unexpected player concentration in particular bet types.
Academic papers published through the University of Nevada, Las Vegas gaming research program emphasize the value of combining regulatory submissions with anonymized operator telemetry, because isolated datasets frequently miss cross-vertical substitution effects that only appear when multiple product lines are examined together. Such combined views become especially relevant during July 2026 when overlapping tournaments compress the calendar and heighten substitution opportunities.
Conclusion
Yield variations during peak remote gaming periods arise from measurable interactions between traffic volume, game selection, and promotional activity rather than from any single dominant factor. Regulatory filings and industry datasets continue to document these movements across jurisdictions, providing operators and analysts with increasingly granular inputs for planning and compliance. As event calendars evolve, the same analytical frameworks applied to 2026 fixtures will support ongoing comparisons that separate structural patterns from transient noise.